Originally published on Maker.io (DigiKey).
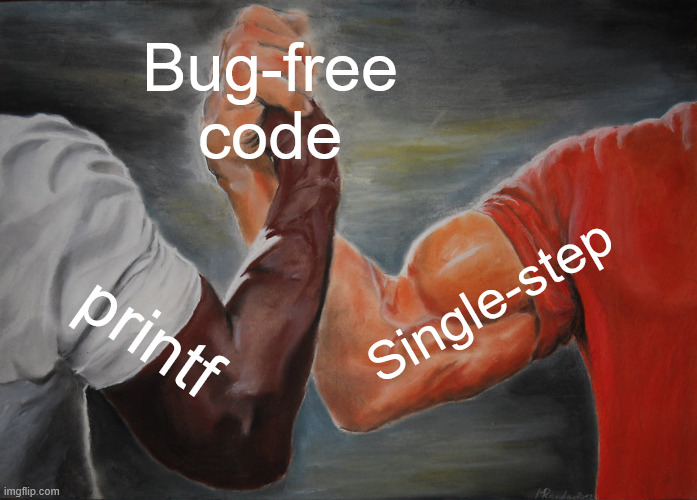
Single-step debugging is powerful — breakpoints, memory inspection, live value modification — but it works at the instruction level, one moment at a time. Printf debugging works at a different scale: it shows you function call sequences, timing relationships, and system behavior across a full run. Calling one inferior to the other misses the point; they solve different problems.
Printf is the better tool when you need to know the sequence of calls across many functions, when you need to measure timing between events, when halting the processor would change the behavior you’re trying to observe (Heisenbugs, motor control, multi-threaded code), or when you need to watch a value across hundreds of iterations rather than pausing on one at a time.
Used together, they’re faster than either alone: a log file points you toward the problematic module at a macro scale before you’ve stopped execution once. That narrows where you point the single-step debugger.